Interactive LED bar graph
Description
This example shows how to make a bar graph by controlling the Red Pitaya on-board LEDs. The number of LEDs that will be turned ON, corresponds to the value of variable p that can be set by the MATLAB® slider bar.
Required hardware
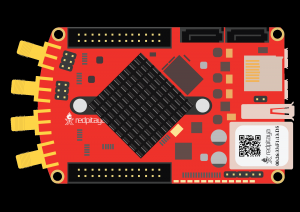
Red Pitaya device
Required software
2.00-23 or higher OS
Note
This code is written for 2.00-23 or higher OS. For older OS versions, please check when specific commands were released (a note is added to each command introduced in 2.00 or higher verisons).
SCPI Code Examples
Code - MATLAB®
The code is written in MATLAB. TCP client communication is used to establish socket communication with Red Pitaya, then SCPI commands are sent to configure the various Red Pitaya peripherals. Copy the code below into the MATLAB editor, save the project and press the Run button. Tested on MATLAB 2024b.
function RedPitaya_sliderDemo

    fig = uifigure("Position", [100 100 300 250]);      % Create figure
    p = 0;

    sld = uislider( ...                                 % Create slider
        Parent= fig,...                                 % Parent figure
        Value= 0,...                                    % Default value
        Limits= [0 100],...                             % Slider limits
        Orientation= 'horizontal',...                   % Orientation
        ValueChangedFcn= @(src, event)sliderCallback(src, event, p));
                                                        % Callback function
    function  sliderCallback(src, event, p)
        p = event.Value;                                % Update p with value of slider

        %% Define Red Pitaya as TCP/IP object
        IP = 'rp-f0a235.local';                         % Input IP of your Red Pitaya...
        port = 5000;
        RP = tcpclient(IP, port);

        %% Open connection with your Red Pitaya
        RP.ByteOrder = 'big-endian';
        configureTerminator(RP, 'CR/LF');

        if p >=(100/9)
            writeline(RP,'DIG:PIN LED0,1')
        else
            writeline(RP,'DIG:PIN LED0,0')
        end

        if p >=(100/9)*2
            writeline(RP,'DIG:PIN LED1,1')
        else
            writeline(RP,'DIG:PIN LED1,0')
        end

        if p >=(100/9)*3
            writeline(RP,'DIG:PIN LED2,1')
        else
            writeline(RP,'DIG:PIN LED2,0')
        end

        if p >=(100/9)*4
            writeline(RP,'DIG:PIN LED3,1')
        else
            writeline(RP,'DIG:PIN LED3,0')
        end

        if p >=(100/9)*5
            writeline(RP,'DIG:PIN LED4,1')
        else
            writeline(RP,'DIG:PIN LED4,0')
        end

        if p >=(100/9)*6
            writeline(RP,'DIG:PIN LED5,1')
        else
            writeline(RP,'DIG:PIN LED5,0')
        end

        if p >=(100/9)*7
            writeline(RP,'DIG:PIN LED6,1')
        else
            writeline(RP,'DIG:PIN LED6,0')
        end

        if p >=(100/9)*8
            writeline(RP,'DIG:PIN LED7,1')
        else
            writeline(RP,'DIG:PIN LED7,0')
        end

        clear RP;
    end
end
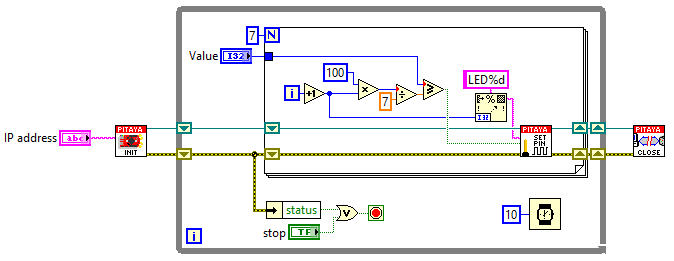
Code - LabVIEW