3.2.2. Arbitrary Waveform Manager
The Arbitrary Waveform Manager is an upgrade to the Signal Generator Application, which comes as a part of the Oscilloscope and Signal Generator and the Spectrum Analyzer applications, bringing to life arbitrary waveform generation. This excellent utility, previously exclusive to SCPI and API commands is now available in the form of Arbitray Waveform Manager application.
Arbitrary Waveform Manager is available on all Red Pitaya boards with the exception of STEMlab 125-14 4-Input version (does not have fast analog outputs).
Features
Upload one period of a custom waveform to Red Pitaya
Generate custom waveforms from Oscilloscope and Spectrum Analyzer applications
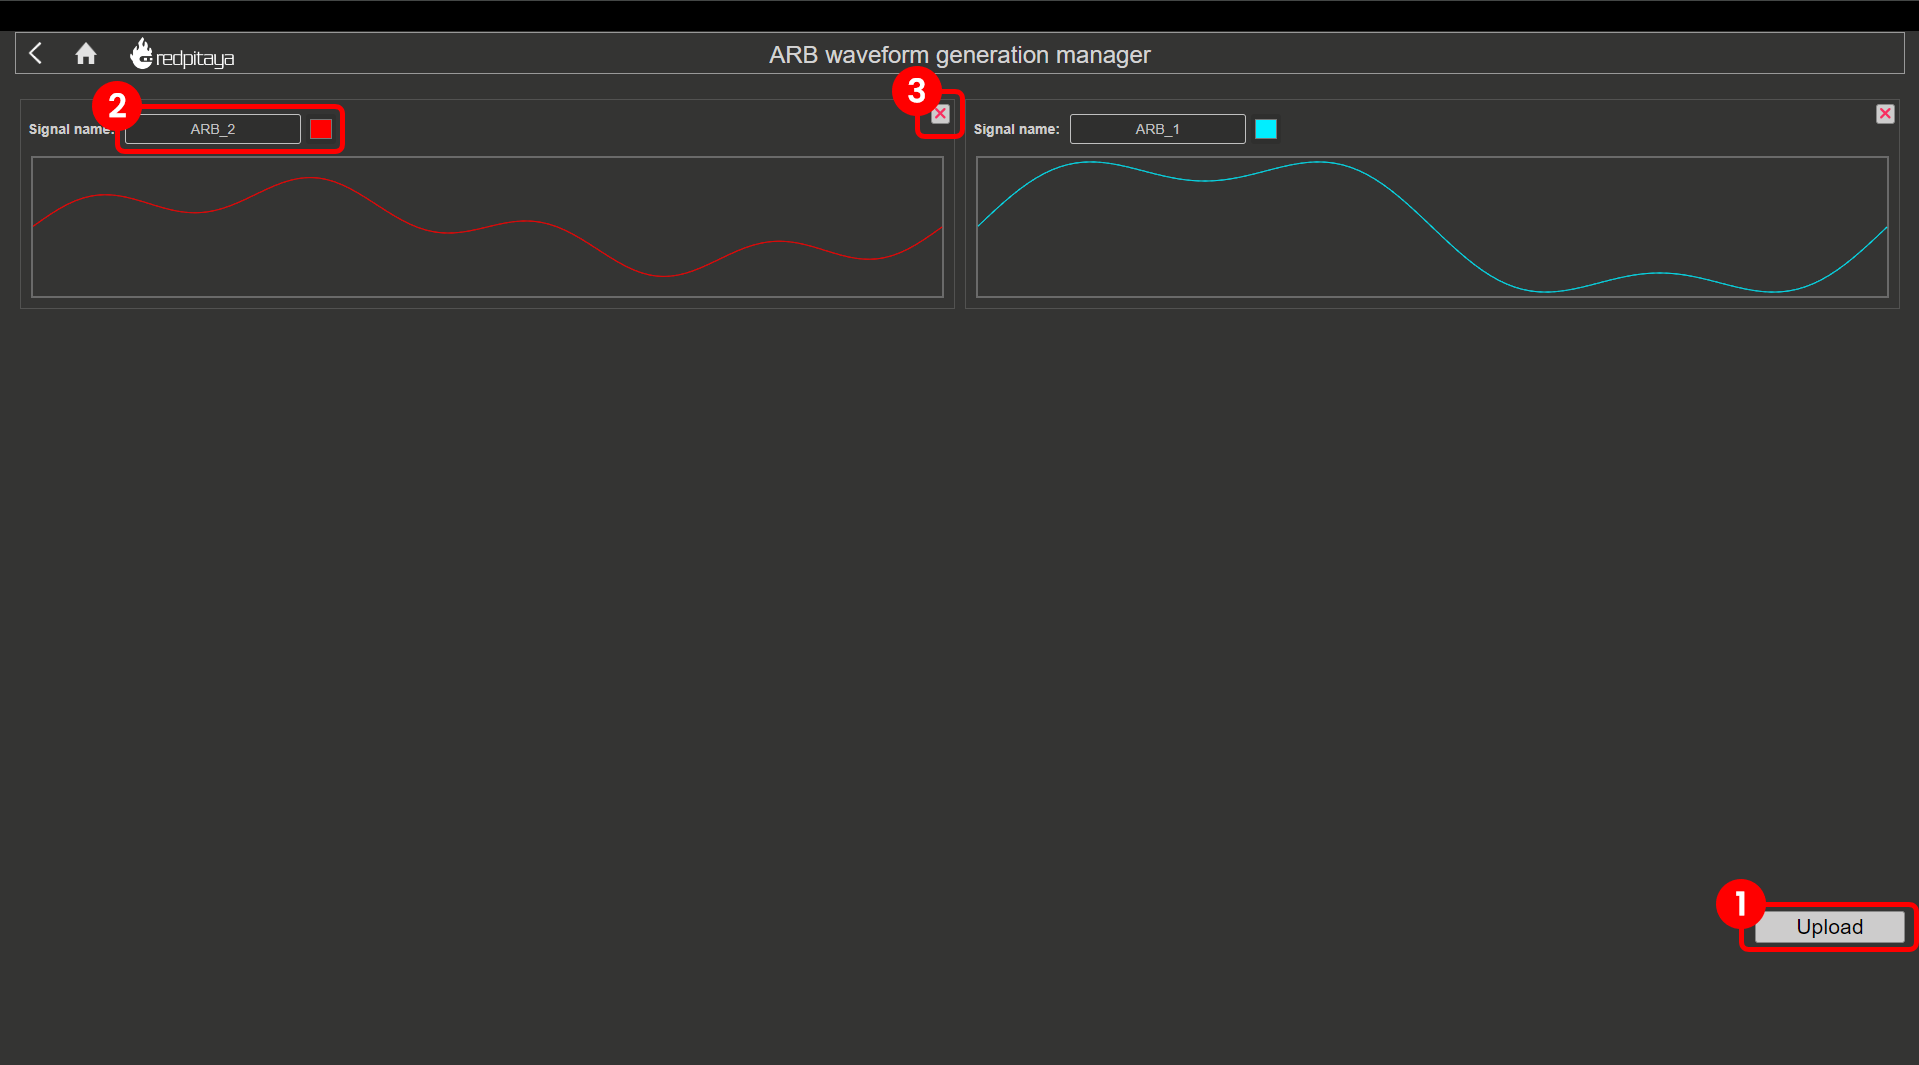
Upload: Button to upload a CSV file with custom waveform.
Signal name and colour: Change custom signal name and waveform colour.
Delete waveform: Delete custom waveform.
Uploading custom waveforms
To upload a custom signal to Arbitrary waveform generator follow the setps below.
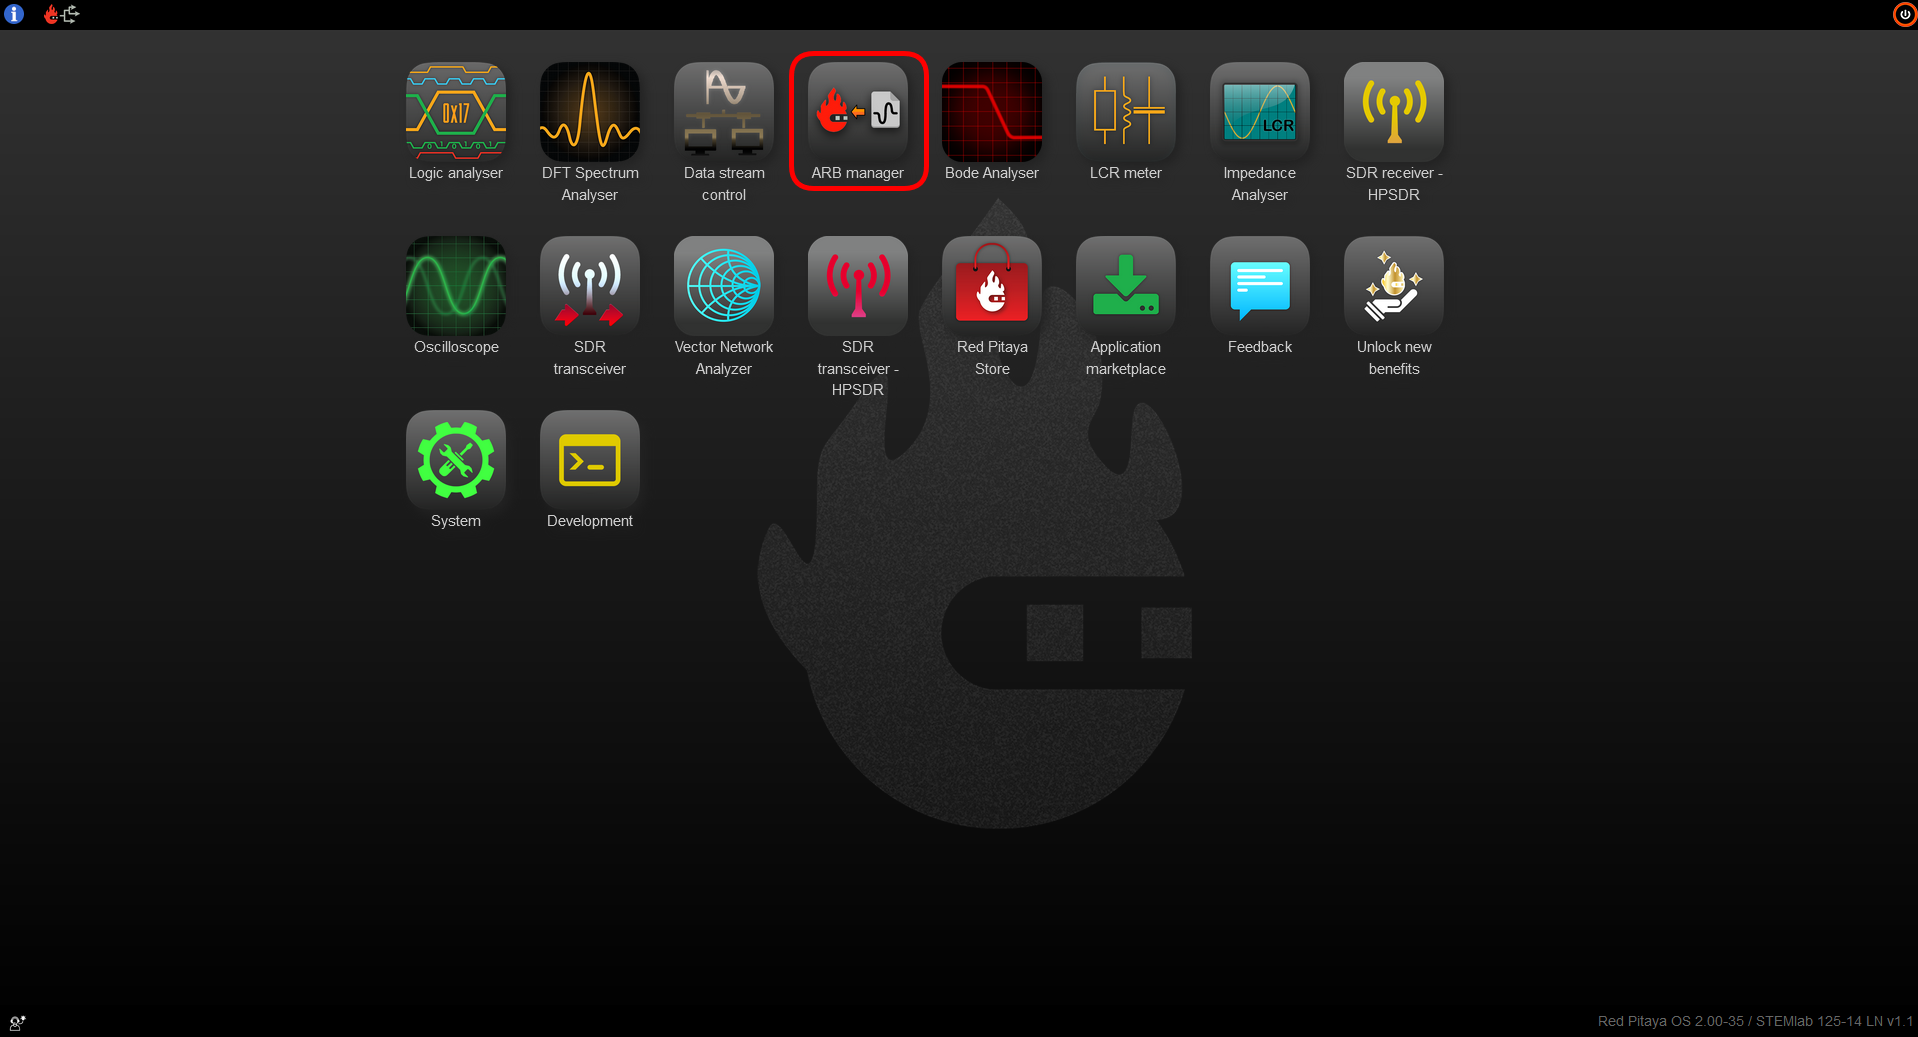
Open Arbitrary Waveform Manager
Click on the Upload button and upload a CSV file containing one period of a custom signal with 16384 samples/points.
Wait for the signal to appear on the screen.
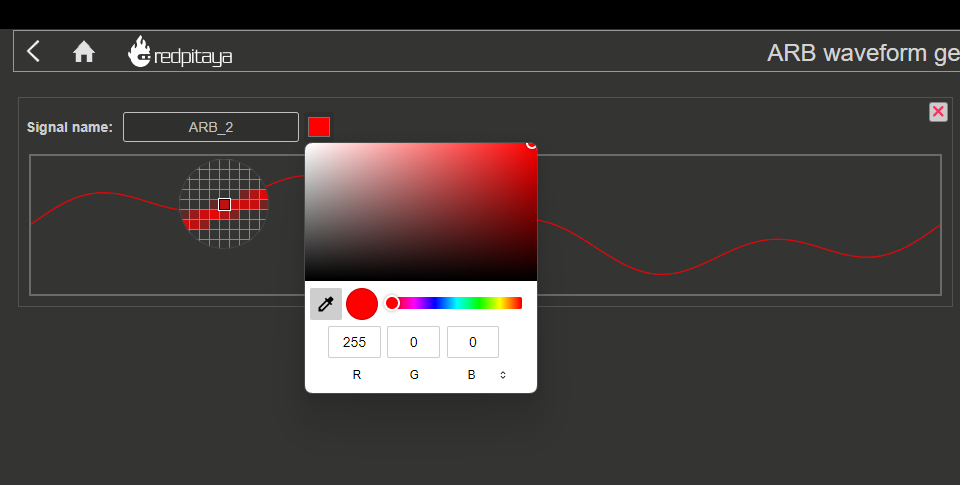
Configure waveform name and colour. To change the name click into the name field, to change the colour click into the colour field. The color can be selected from the screen with the eyedropper tool or configured through the colour manager utility that pops up.
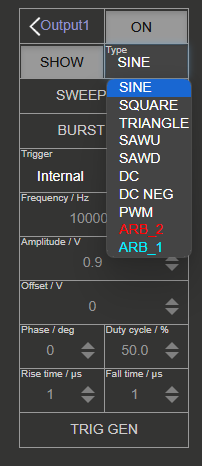
Exit ARB Manager and open Oscilloscope or Spectrum Analyzer. Custom waveforms should appear in the Waveform Type drop-down menu. They can easily be distinguished from the standard waveforms through the custom font colours which match the waveform colours set in the ARB Manager.
Note
Waveform Data Format and Amplitude Control
All waveform values must be normalized to the range
[-1, 1], where value1represents the maximum DAC output and-1represents the minimum.The waveform data is a template that defines the signal shape only; it does NOT contain amplitude information.
The actual output amplitude is controlled independently via the amplitude/voltage slider in the Oscilloscope/Spectrum Analyzer app or via the
SOUR<n>:VOLTSCPI command.The FPGA applies the formula: Output = (Waveform Template Value × Calibrated Amplitude Multiplier) + Calibration Offset
The calibration multipliers account for the DAC’s full-scale range, which the FPGA does not inherently know.
Example code for creating a custom waveform
Here is an example of Python code for creating a custom waveform.
#!/usr/bin/env python3

import numpy as np
import pandas as pd
from matplotlib import pyplot as plt

N = 16384                               # Number of samples
t = np.linspace(0, 1, N)*2*np.pi

x = np.sin(t) + 1/3*np.sin(3*t)         # Custom waveform definition
y = 1/2*np.sin(t) + 1/4*np.sin(4*t)

# IMPORTANT: Ensure all waveform values are normalized to [-1, 1]
# The waveform is a TEMPLATE that defines only the signal SHAPE
# The actual output AMPLITUDE is set separately via the volume slider or SOUR<n>:VOLT command

plt.plot(t, x, t, y)                    # Double-check with plot
plt.title('Custom waveform')
plt.show()

# Normalize values to ensure they're in [-1, 1] range
x_norm = x / np.max(np.abs(x))
y_norm = y / np.max(np.abs(y))

# Port waveforms to CSV format
pd.DataFrame(x_norm).to_csv('arb_waveform1.csv', index=False, header=False, float_format=np.float64)
pd.DataFrame(y_norm).to_csv('arb_waveform2.csv', index=False, header=False, float_format=np.float64)
Source code
The Arbitrary Waveform Manager source code is available on our GitHub.