3.2.6. Impedance Analyzer
This application will turn your Red Pitaya into an Impedance analyzer. It is the perfect tool for educators, students, makers, hobbyists, and professionals seeking affordable, highly functional test and measurement equipment.
Impedance is an important parameter used to characterize electronic components, electronic circuits, and the materials used to make components. Impedance analysis can also be used to characterize materials exhibiting dielectric behavior such as biological tissue, foodstuffs or geological samples (Wikipedia - impedance analyzer)
The impedance analyzer uses the direct current-voltage method and has a frequency range from 1 Hz to 50 MHz. The frequency range and number of measurements can be arbitrarily selected.
All Red Pitaya applications are web-based and do not require the installation of any native software. Users can access them via a web browser using their smartphone, tablet, or a PC running any popular operating system (MAC, Linux, Windows, Android, and iOS).
Features
The impedance analyzer enables the measurement of the following parameters:
Impedance \(|Z|\, [Ω]\)
Phase \(P\, [°]\)
Admittance \(Y\, [S]\)
Inverse phase \(-P\, [°]\)
Serial resistance \(R_S\, [Ω]\)
Parallel resistance \(R_P\, [Ω]\)
Serial reactance \(X_S\, [Ω]\)
Parallel conductance \(G_P\, [S]\)
Parallel susceptance \(B_P\, [S]\)
Serial capacitance \(C_S\, [F]\)
Parallel capacitance \(C_P\, [F]\)
Serial inductance \(L_S\, [H]\)
Parallel inducatnce \(L_P\, [H]\)
Quality factor \(Q\)
Dissipation factor \(D\)

The graphical user interface of the Impedance analyzer application is divided into 4 areas:
Top settings menu: Export data, reset settings and start or stop the measurements.
Measurement control panel: Set the shunt resistior, measurement parameters, plot settings, and put cursors on the main graph area.
Current measurement data: The current step number and frequency of generated pulses required for the measurement.
Main graph area: Main graph area displays the impedance response of the DUT (device under test).
Top settings menu

Top settings menu contains the following functionality:
Question mark button: Leads to the impedance analyzer documentation webpage (here)
Menu dropdown:
Export data: Export the currently displayed data as either a “Graph” or a “CSV file”. If graph is chosen, a screenshot of the application is taken and automatically downloads via the browser. Otherwise, a CSV file with data is downloaded from the board.
Reset: Resets all impedance analyzer application settings back to default.
Stop/Run button: Start and stop the measurement.
Measurement control panel
Here we can set measurement parameters such as the frequency range, scale, number of steps, excitation signal amplitude, excitation signal DC bias, and averaging number.
Settings

Start frequency [Hz]: The impedance analyzer starts measuring the DUT frequency response at this frequency. Minimum value of the frequency axis.
End frequency [Hz]: The impedance analyzer ends measuring the DUT frequency response at this frequency. Maximum value of the frequency axis.
Steps: Number of measurements performed. The frequency range between Start frequency and End frequency is divided according to the measure scale setting and measurements are performed at each point.
Measure scale: Either liner or logarithmic sweep mode (scale). The logarithmic sweep mode enables measurements in a large frequency range, while the linear sweep mode is used for measurements in a small frequency range.
Averaging: Each final result is an average of “Averaging” number of measurements.
Amplitude [V]: Excitation signal amplitude.
DC bias [V]: Excitation signal DC bias (offset).
Shunt [Ω] Resistance value of the shunt resistor.
Note
The sum of Amplitude and DC bias is capped at 1 Volt. For example, if Amplitude is set to 0.4 V, the DC bias can be set to a maximum of 0.6 V.
Plot settings

The frequency axis is scalled to show the full range between start and end frequencies (the axis range changes with the frequency setting). The Y-axis is automatically scalled depending on the measured data.
Y-axis data: Choose between the following data options. Once the measurements are taken, the graph automatically recalculates the data to the chosen setting:
Impedance \(|Z|\, [Ω]\)
Phase \(P\, [°]\)
Admittance \(Y\, [S]\)
Inverse phase \(-P\, [°]\)
Serial resistance \(R_S\, [Ω]\)
Parallel resistance \(R_P\, [Ω]\)
Serial reactance \(X_S\, [Ω]\)
Parallel conductance \(G_P\, [S]\)
Parallel susceptance \(B_P\, [S]\)
Serial capacitance \(C_S\, [F]\)
Parallel capacitance \(C_P\, [F]\)
Serial inductance \(L_S\, [H]\)
Parallel inducatnce \(L_P\, [H]\)
Quality factor \(Q\)
Dissipation factor \(D\)
Measurement scale: Either liner or logarithmic. Affects the display of Y-axis data.
Cursor settings
Up to two cursors can be put on each of the axis. The cursors each show the current value and the absolute difference between the two cursors on the same axis. Cursors can be moved with Click+Drag.
LCR meter indicator
The indicator displays a green light when the LCR meter extension board is connected. Otherwise, a red light is shown.
How to use the impedance analyzer
The impedance analyzer requires either the LCR meter extension module or an external shunt resistor for proper operation. Each method has its own upsides and downsides. Here is a quick guide on how to set up the hardware.
LCR extension module
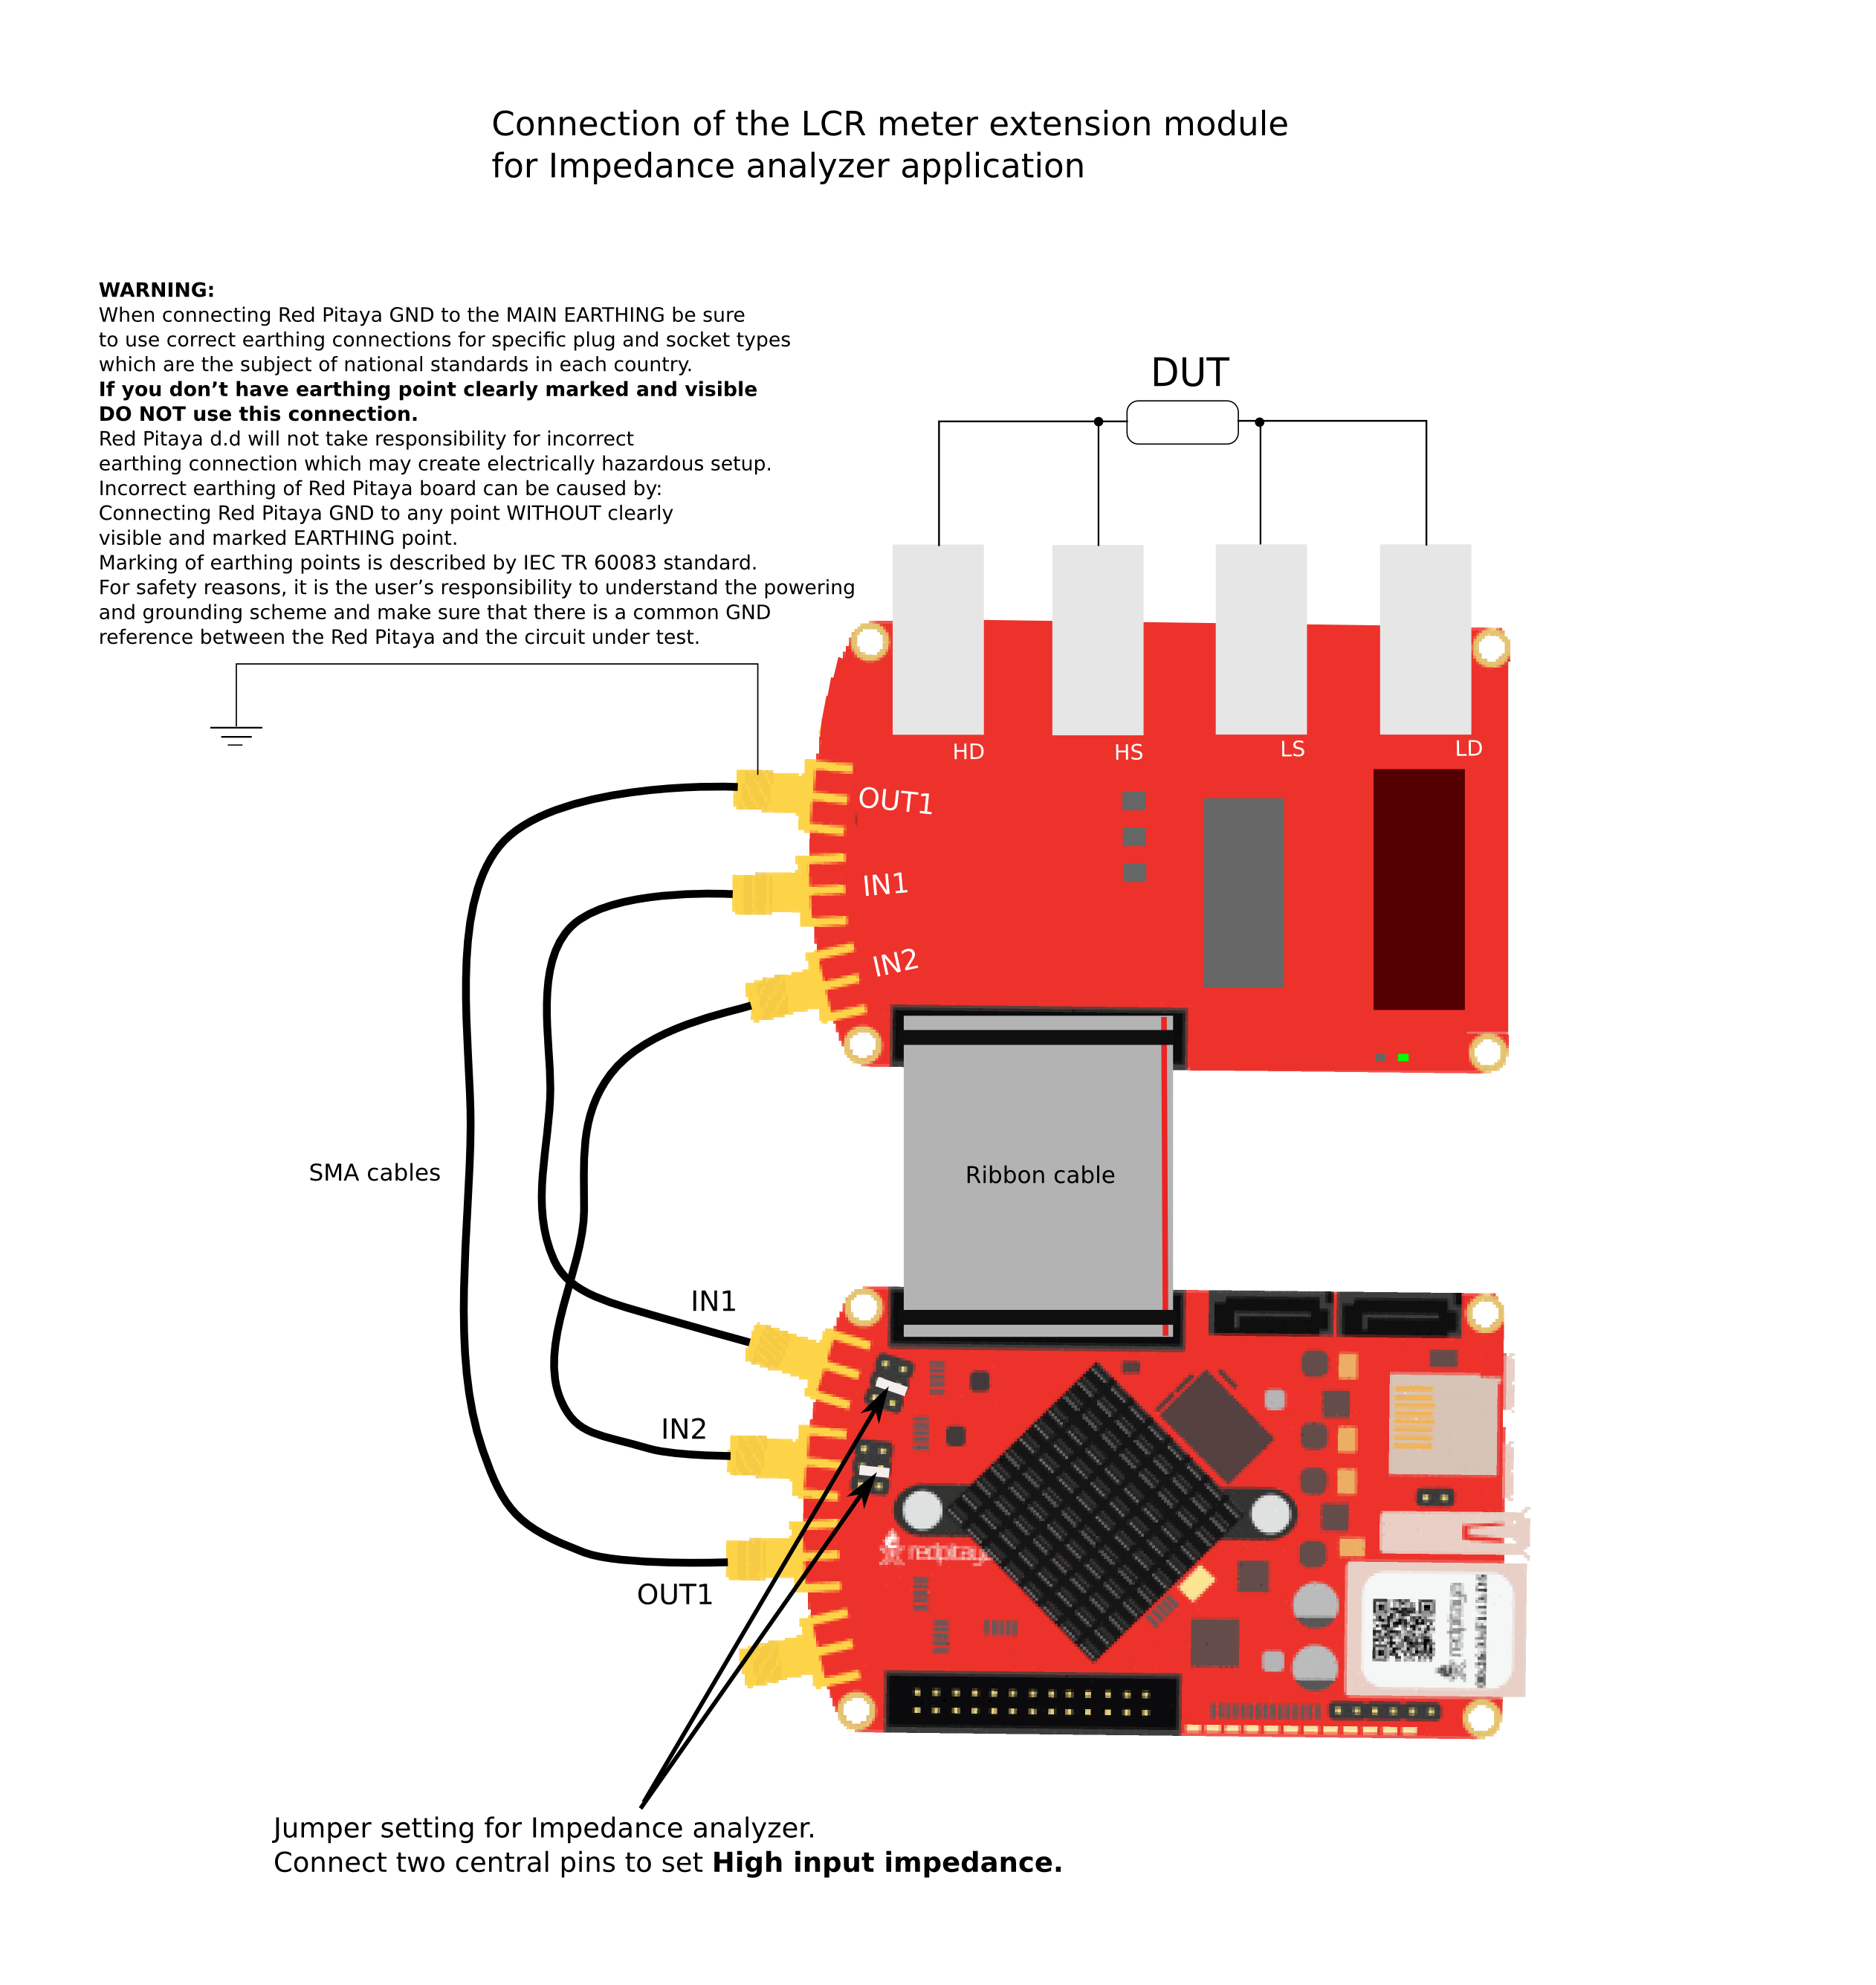
The LCR meter extension module is easier to connect and automatically switches between the following shunt resistor values:
10 Ω
100 Ω
1 kΩ
10 kΩ
100 kΩ
1 MΩ
Read more about the LCR meter extension module in our documentation.
External shunt resistor

Note
To minimise the effect of Red Pitaya’s input impedance on measurements, reconfigure the jumpers as shown in the figure above (connect the middle two pins on both inputs) to bypass the input resistor divider. This reduces the input voltage range to +-0.5 V, so ensure that the output voltage setting does not exceed +-0.5 V (absolute maximum 0.75 V).
Choosing a Shunt Resistor
When using an optimum shunt, the dynamic input ranges for both IN1 (voltage measurement) and IN2 (current measurement) are maximised. This means that the voltage goes from 0 to the maximum value (0.5 V) in the specified frequency range. The optimum shunt resistor value is highly dependent on the DUT and the selected frequency range.
Selecting the optimum shunt is an iterative process, maximising the dynamic input range.
First select the starting value by guessing the resistor value (e.g. start with a resistor value of power 10). If an approximate impedance of the DUT is already known, the starting value will be more accurate.
Start the first iteration by measuring the dynamic range at IN2 in the selected frequency range (for example, by generating a sweep signal through the circuit).
Change the value of the shunt resistor with the aim of increasing the dynamic range at IN2 while keeping the other settings the same.
Repeat steps 2 and 3 until the change in dynamic range is negligible.

Figure 3.1 Example of measuring the impedance of a parallel RLC circuit.
Source code
The Impedance Analyzer source code is available on our GitHub.