2.3.6.1.4. Interactive LED bar graph
2.3.6.1.4.1. Description
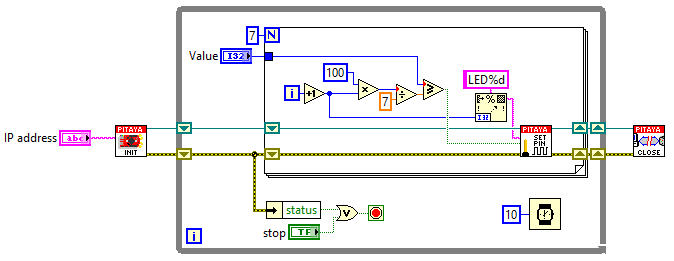
This example shows how to make a bar graph by controlling the Red Pitaya on-board LEDs. The number of LEDs that will be turned ON, corresponds to the value of variable p that can be set by the MATLAB® slider bar.
2.3.6.1.4.3. SCPI Code Examples
2.3.6.1.4.3.1. Code - MATLAB®
The code is written in MATLAB. In the code, we use SCPI commands and TCP client communication. Copy the code from below into the MATLAB editor, save the project, and hit the “Run” button. Change p with slider bar from 0-100.
function RP_sliderDemo

    f = figure(1);
    global p;

    %// initialize the slider
    h = uicontrol(...
        'parent'  , f,...
        'units'   , 'normalized',...                 %// pixels settings
        'style'   , 'slider',...
        'position', [0.05 0.05 0.9 0.05],...
        'min'     , 1,...                            %// Make the "value" between min ...
        'max'     , 100,...                          %// max 10, with initial value
        'value'   , 10,...                           %// as set.
        'callback', @sliderCallback);                %// This is called when using the
                                                    %// arrows
                                                    %// and/or when clicking the slider bar

    hLstn = handle.listener(h,'ActionEvent',@sliderCallback);
    %// (variable appears unused, but not assigning it to anything means that
    %// the listener is stored in the 'ans' variable. If "ans" is overwritten,
    %// the listener goes out of scope and is thus destroyed, and thus, it no
    %// longer works.

    function  sliderCallback(~,~)
        p = (get(h,'value'));

        % Define Red Pitaya as TCP client object
        IP = '192.168.178.56';           % Input IP of your Red Pitaya...
        port = 5000;
        RP = tcpclient(IP, port);

        %% Open connection with your Red Pitaya
        RP.ByteOrder = 'big-endian';
        configureTerminator(RP, 'CR/LF');

        if p >=(100/8)
            writeline(RP,'DIG:PIN LED0,1');
        else
            writeline(RP,'DIG:PIN LED0,0');
        end

        if p >=(100/8)*2
            writeline(RP,'DIG:PIN LED1,1');
        else
            writeline(RP,'DIG:PIN LED1,0');
        end

        if p >=(100/8)*3
            writeline(RP,'DIG:PIN LED2,1');
        else
            writeline(RP,'DIG:PIN LED2,0');
        end

        if p >=(100/8)*4
            writeline(RP,'DIG:PIN LED3,1');
        else
            writeline(RP,'DIG:PIN LED3,0');
        end

        if p >=(100/8)*5
            writeline(RP,'DIG:PIN LED4,1');
        else
            writeline(RP,'DIG:PIN LED4,0');
        end

        if p >=(100/8)*6
            writeline(RP,'DIG:PIN LED5,1');
        else
            writeline(RP,'DIG:PIN LED5,0');
        end

        if p >=(100/8)*7
            writeline(RP,'DIG:PIN LED6,1');
        else
            writeline(RP,'DIG:PIN LED6,0');
        end

        if p >=(100/8)*8
            writeline(RP,'DIG:PIN LED7,1');
        else
            writeline(RP,'DIG:PIN LED7,0');
        end

        clear RP;
    end
end