2.3. Connect to Red Pitaya
This guide will help you connect to your Red Pitaya board and access its web interface in just a few simple steps.
2.3.1. Identify your board model
Please refer to the Identify your board model guide to determine which Red Pitaya board model you have before proceeding with the connection steps.
2.3.2. Connection requirements
Before connecting your Red Pitaya, make sure you have:
SD card with Red Pitaya OS installed (see Prepare SD card guide)
Ethernet cable
Power supply:
5V 3A minimum (for Gen 2 boards)
5V 2A minimum (for most Original Gen board models)
24V 0.5A (for SIGNALlab 250-12)
Router or network switch with DHCP enabled (more info)
Computer with a web browser (Chrome, Firefox, Safari, or Edge)
Note
Connection methods:
Red Pitaya supports multiple connection methods:
LAN network connection (recommended - covered in this guide)
Direct Ethernet cable connection (PC to Red Pitaya)
Wi-Fi connection
For alternative connection methods, see the Network manager tool chapter.
2.3.3. Connection steps (all board models)
Follow these five simple steps to connect to your Red Pitaya:
Update the SD card with the latest version.
Insert the SD card into your Red Pitaya board.
Connect to your network - Use an Ethernet cable to connect your Red Pitaya to your router (or a network socket connected to the router).
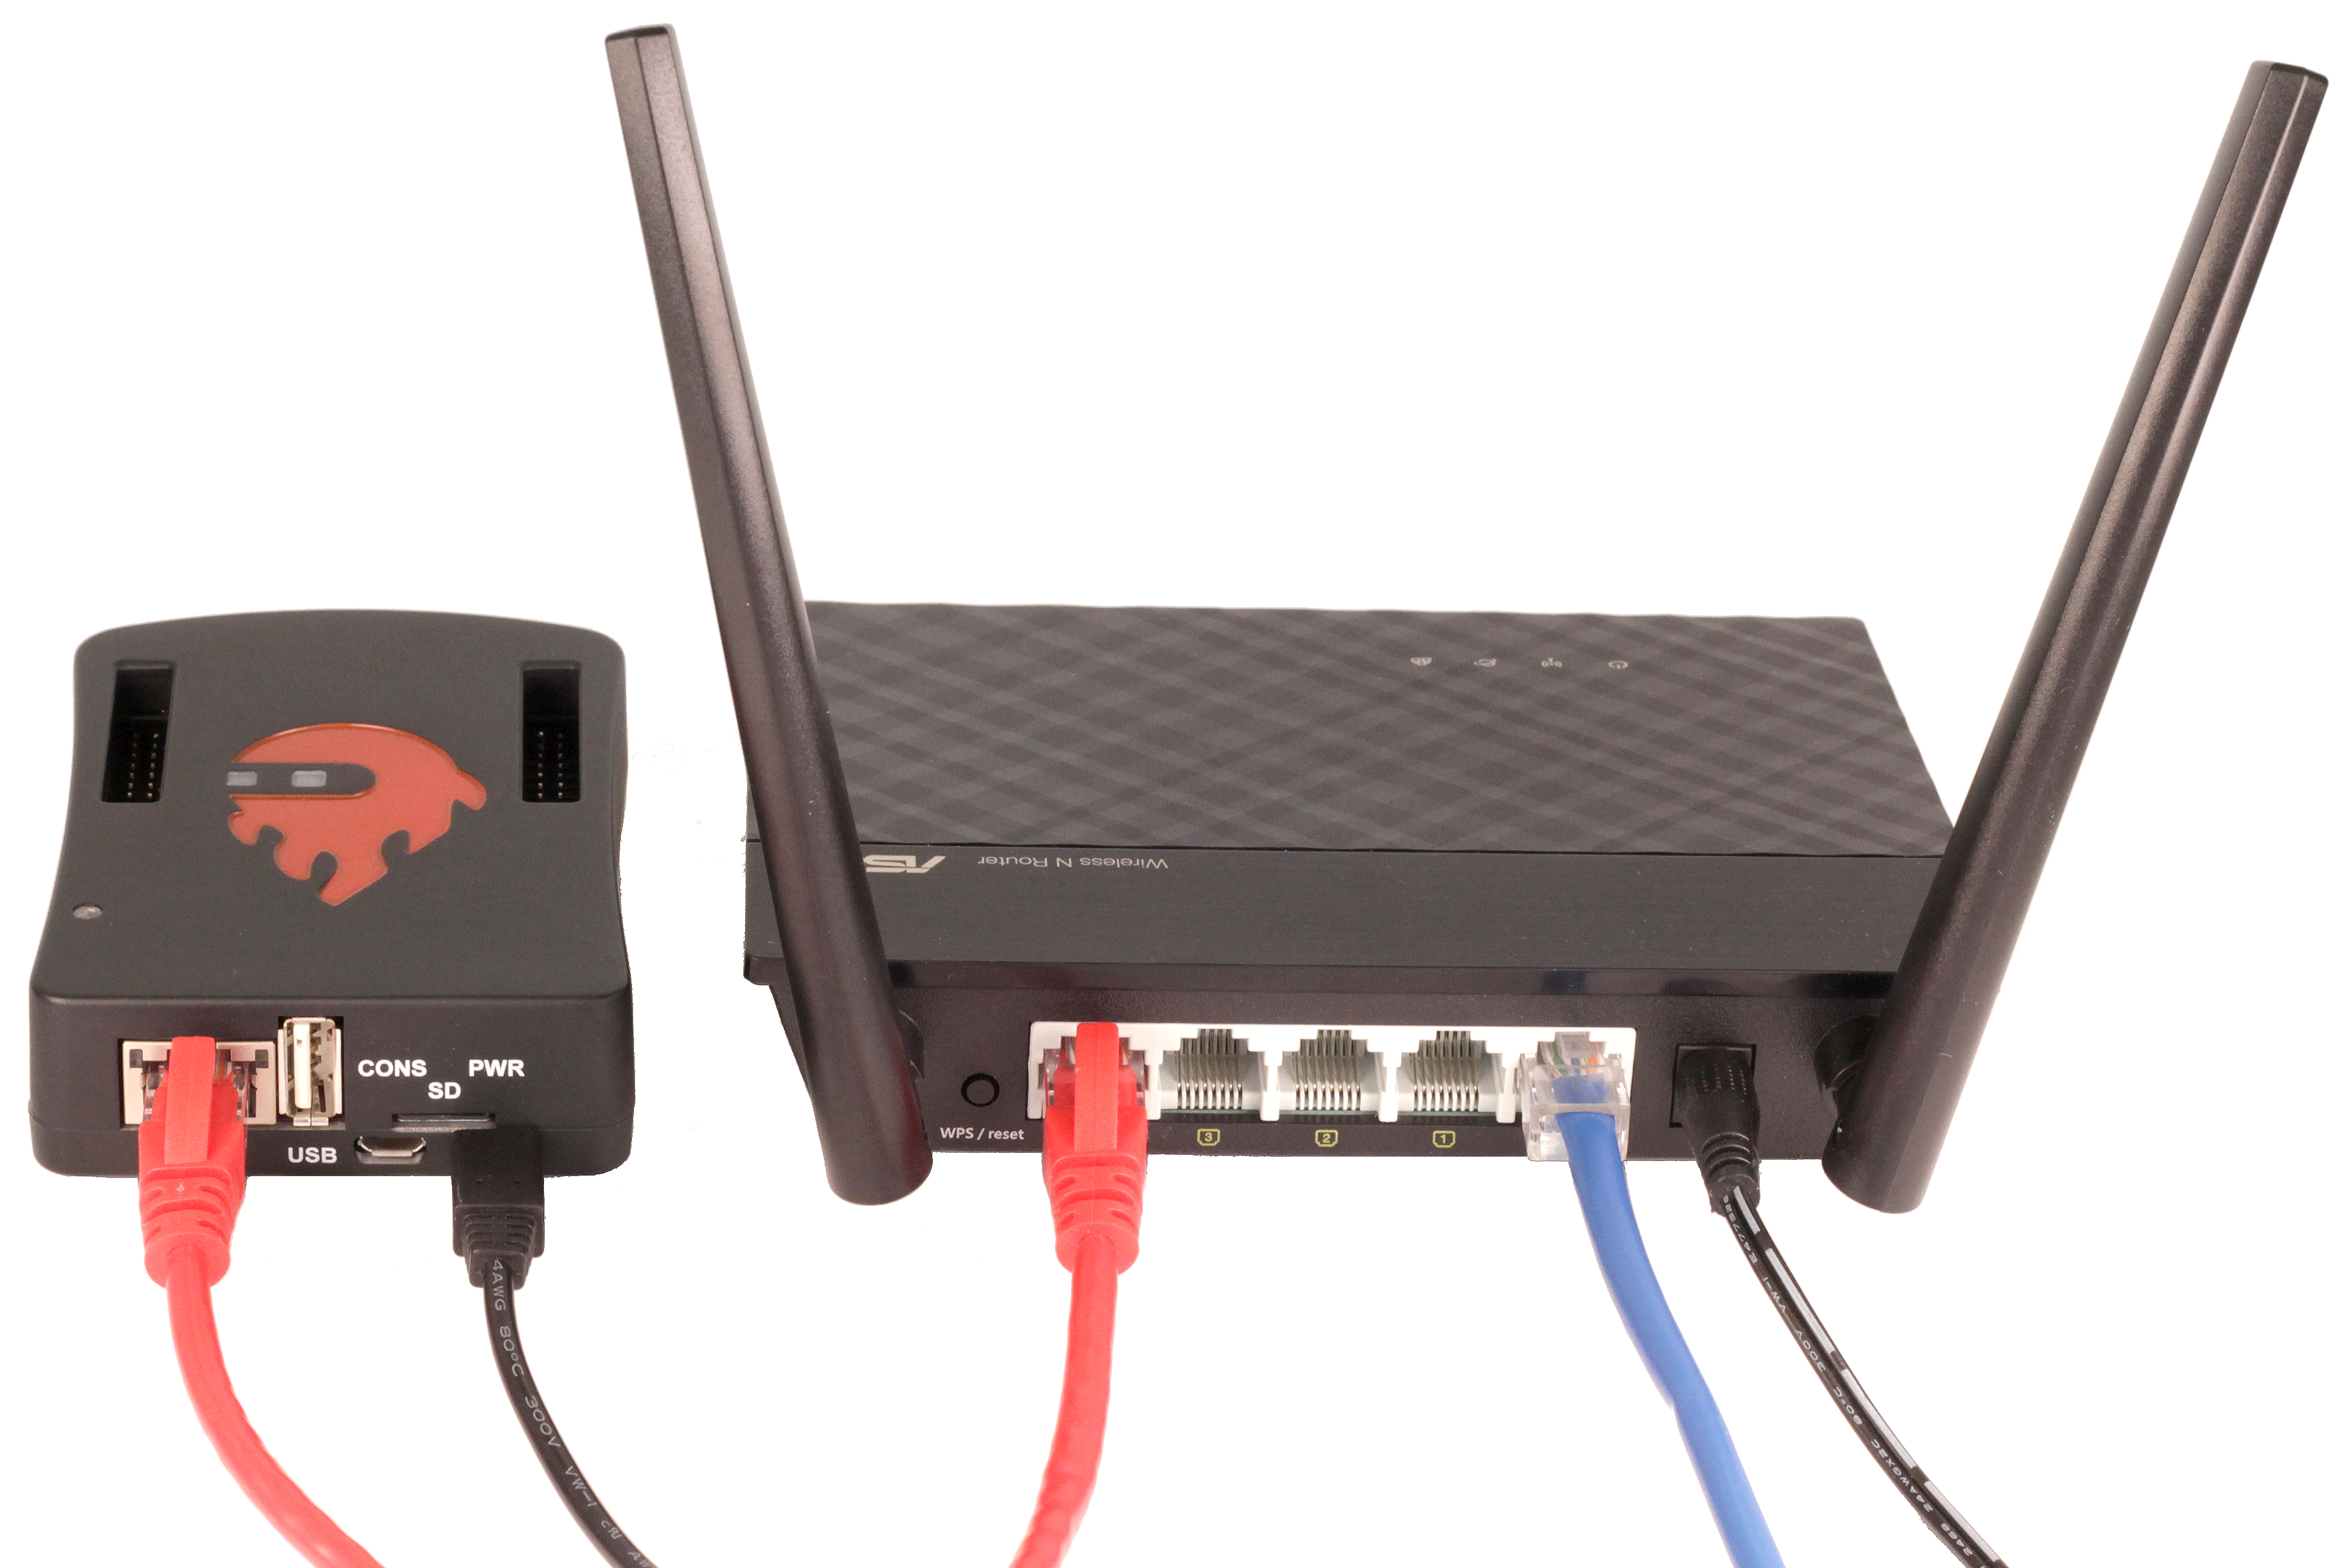
Note: For SIGNALlab 250-12, see the image below:
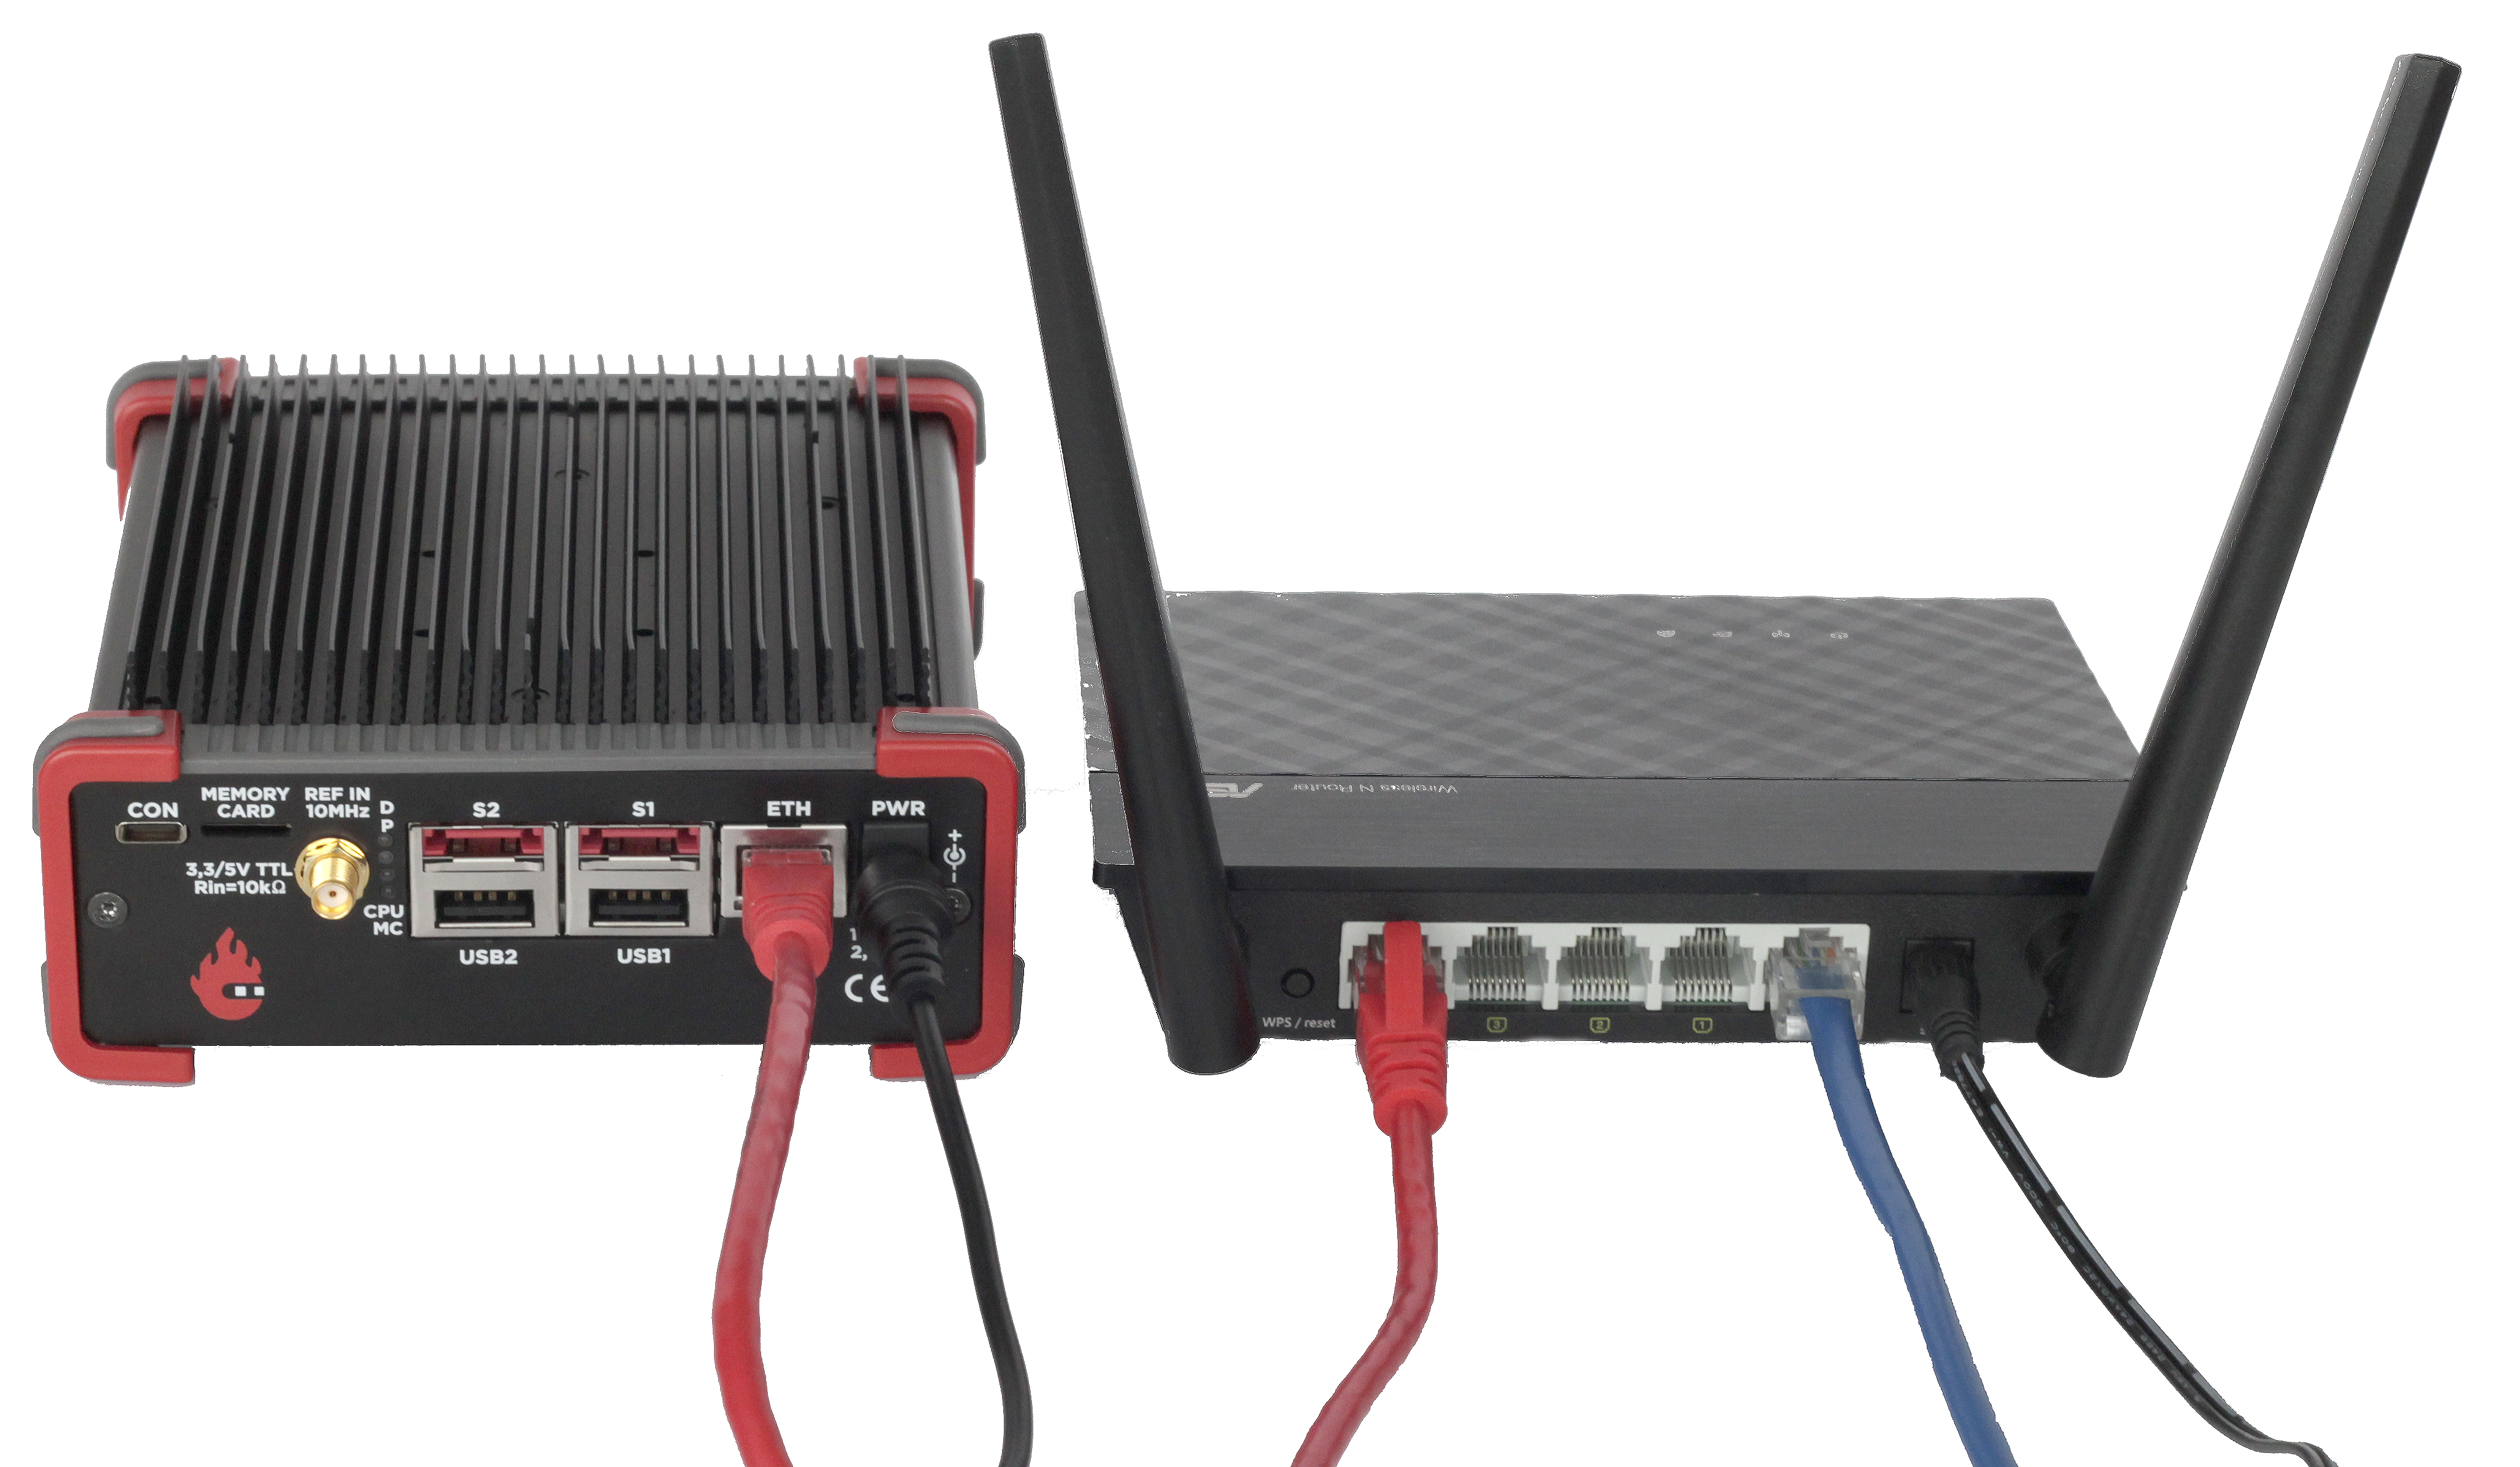
Connect the power supply to your Red Pitaya board.
Warning
QSPI eMMC board users only:
If you have a QSPI eMMC board connected, your Red Pitaya will not boot automatically. After connecting power, you must press and hold the P-ON button on the QSPI eMMC board for 1 second to turn on the Red Pitaya.
Read more in the QSPI eMMC board chapter.
What to expect during boot:
Watch the LED sequence on your board. It should follow this pattern:
If you see unexpected LED behavior, check the troubleshooting section.
Open your web browser and connect to Red Pitaya.
2.3.4. Find your Red Pitaya’s web address
There are two ways to access your Red Pitaya:
Method 1: Using the hostname (recommended)
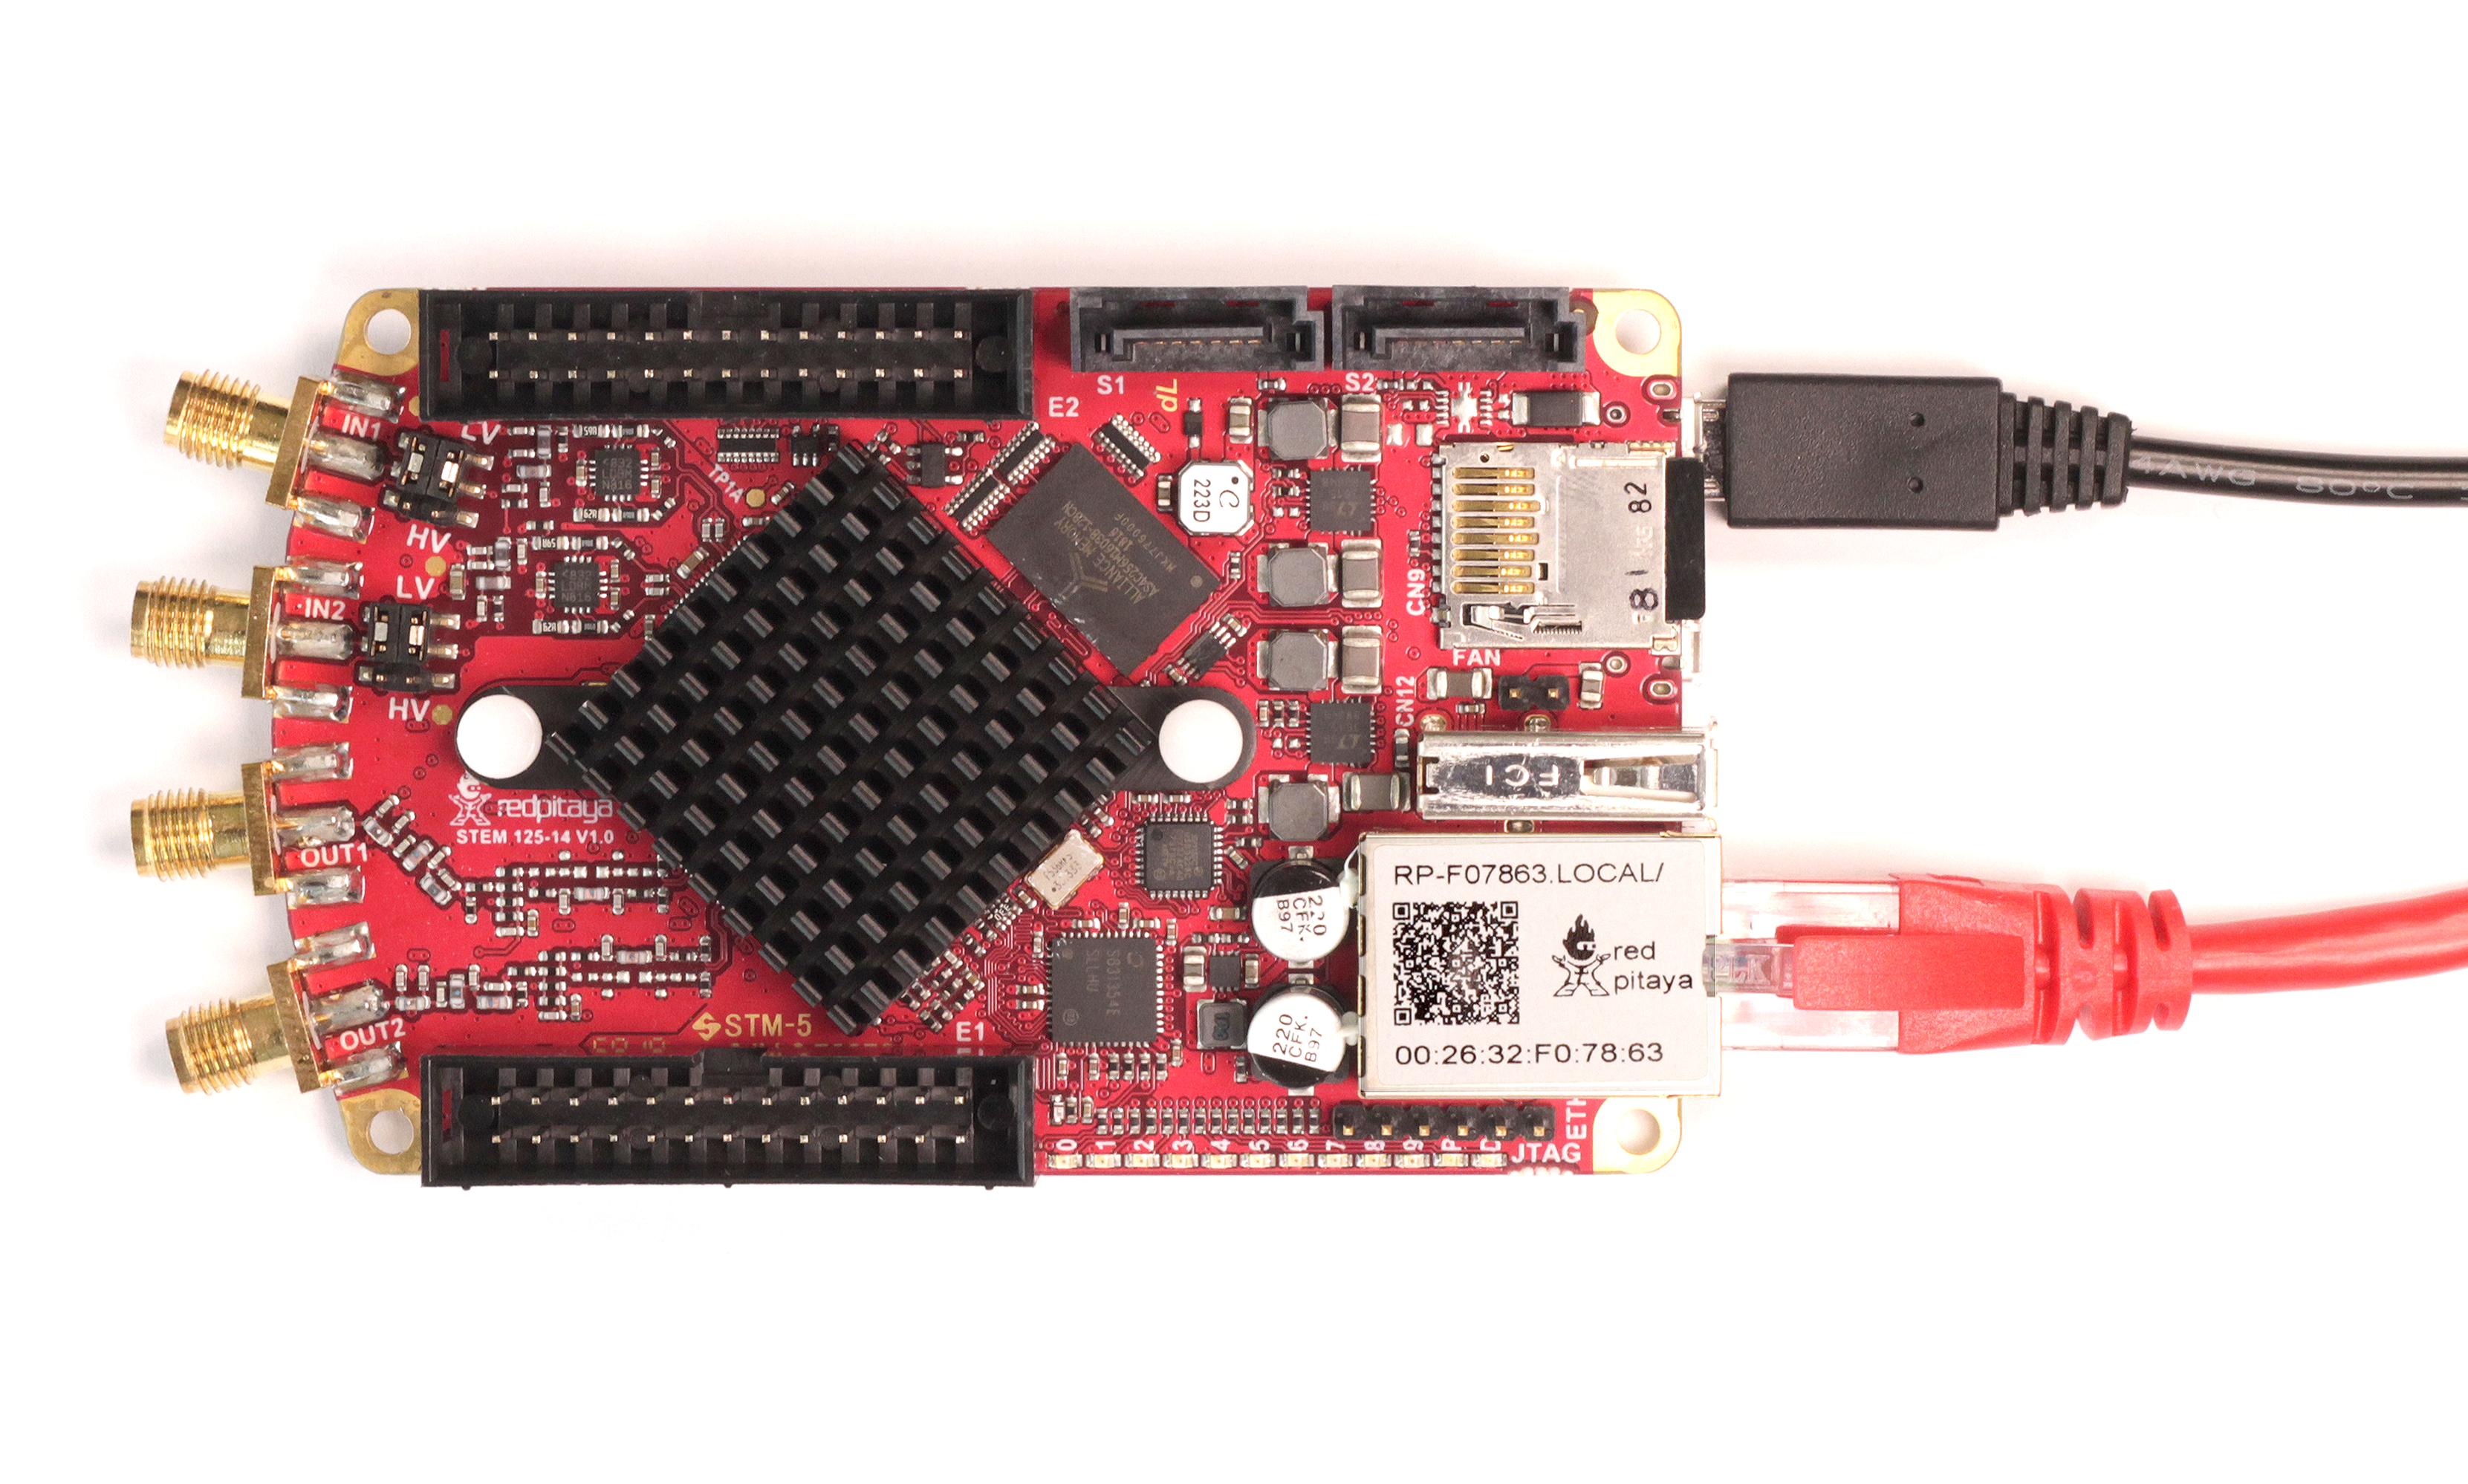
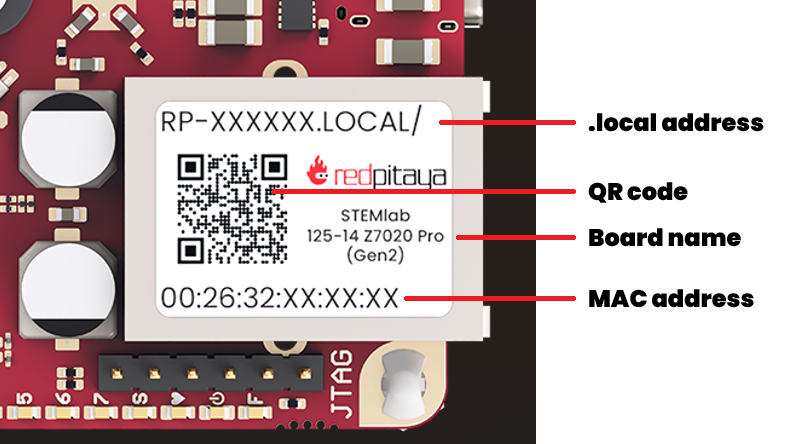
Look at the Ethernet connector on your Red Pitaya. You’ll see a sticker with a code like rp-xxxxxx.
Note
Boards with enclosures (like SIGNALlab 250-12) have the sticker on the bottom of the enclosure instead.
Type this address into your web browser’s address bar, adding .local/ at the end:
rp-xxxxxx.local/
Replace xxxxxx with the six characters from your board’s sticker.
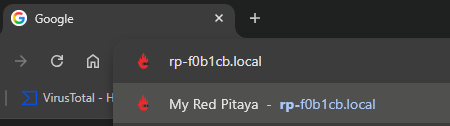
Example of entering the address in your browser
Method 2: Using the IP address
If the hostname method doesn’t work, you can find your Red Pitaya’s IP address:
Open a terminal (macOS/Linux) or Command Prompt (Windows)
Type:
arp -aand press EnterLook for the MAC address that matches the one on your Red Pitaya’s sticker
Use the corresponding IP address in your browser
Example:
192.168.1.100
2.3.5. Success! You’re connected
After following the steps above, you should see the Red Pitaya main page in your browser:
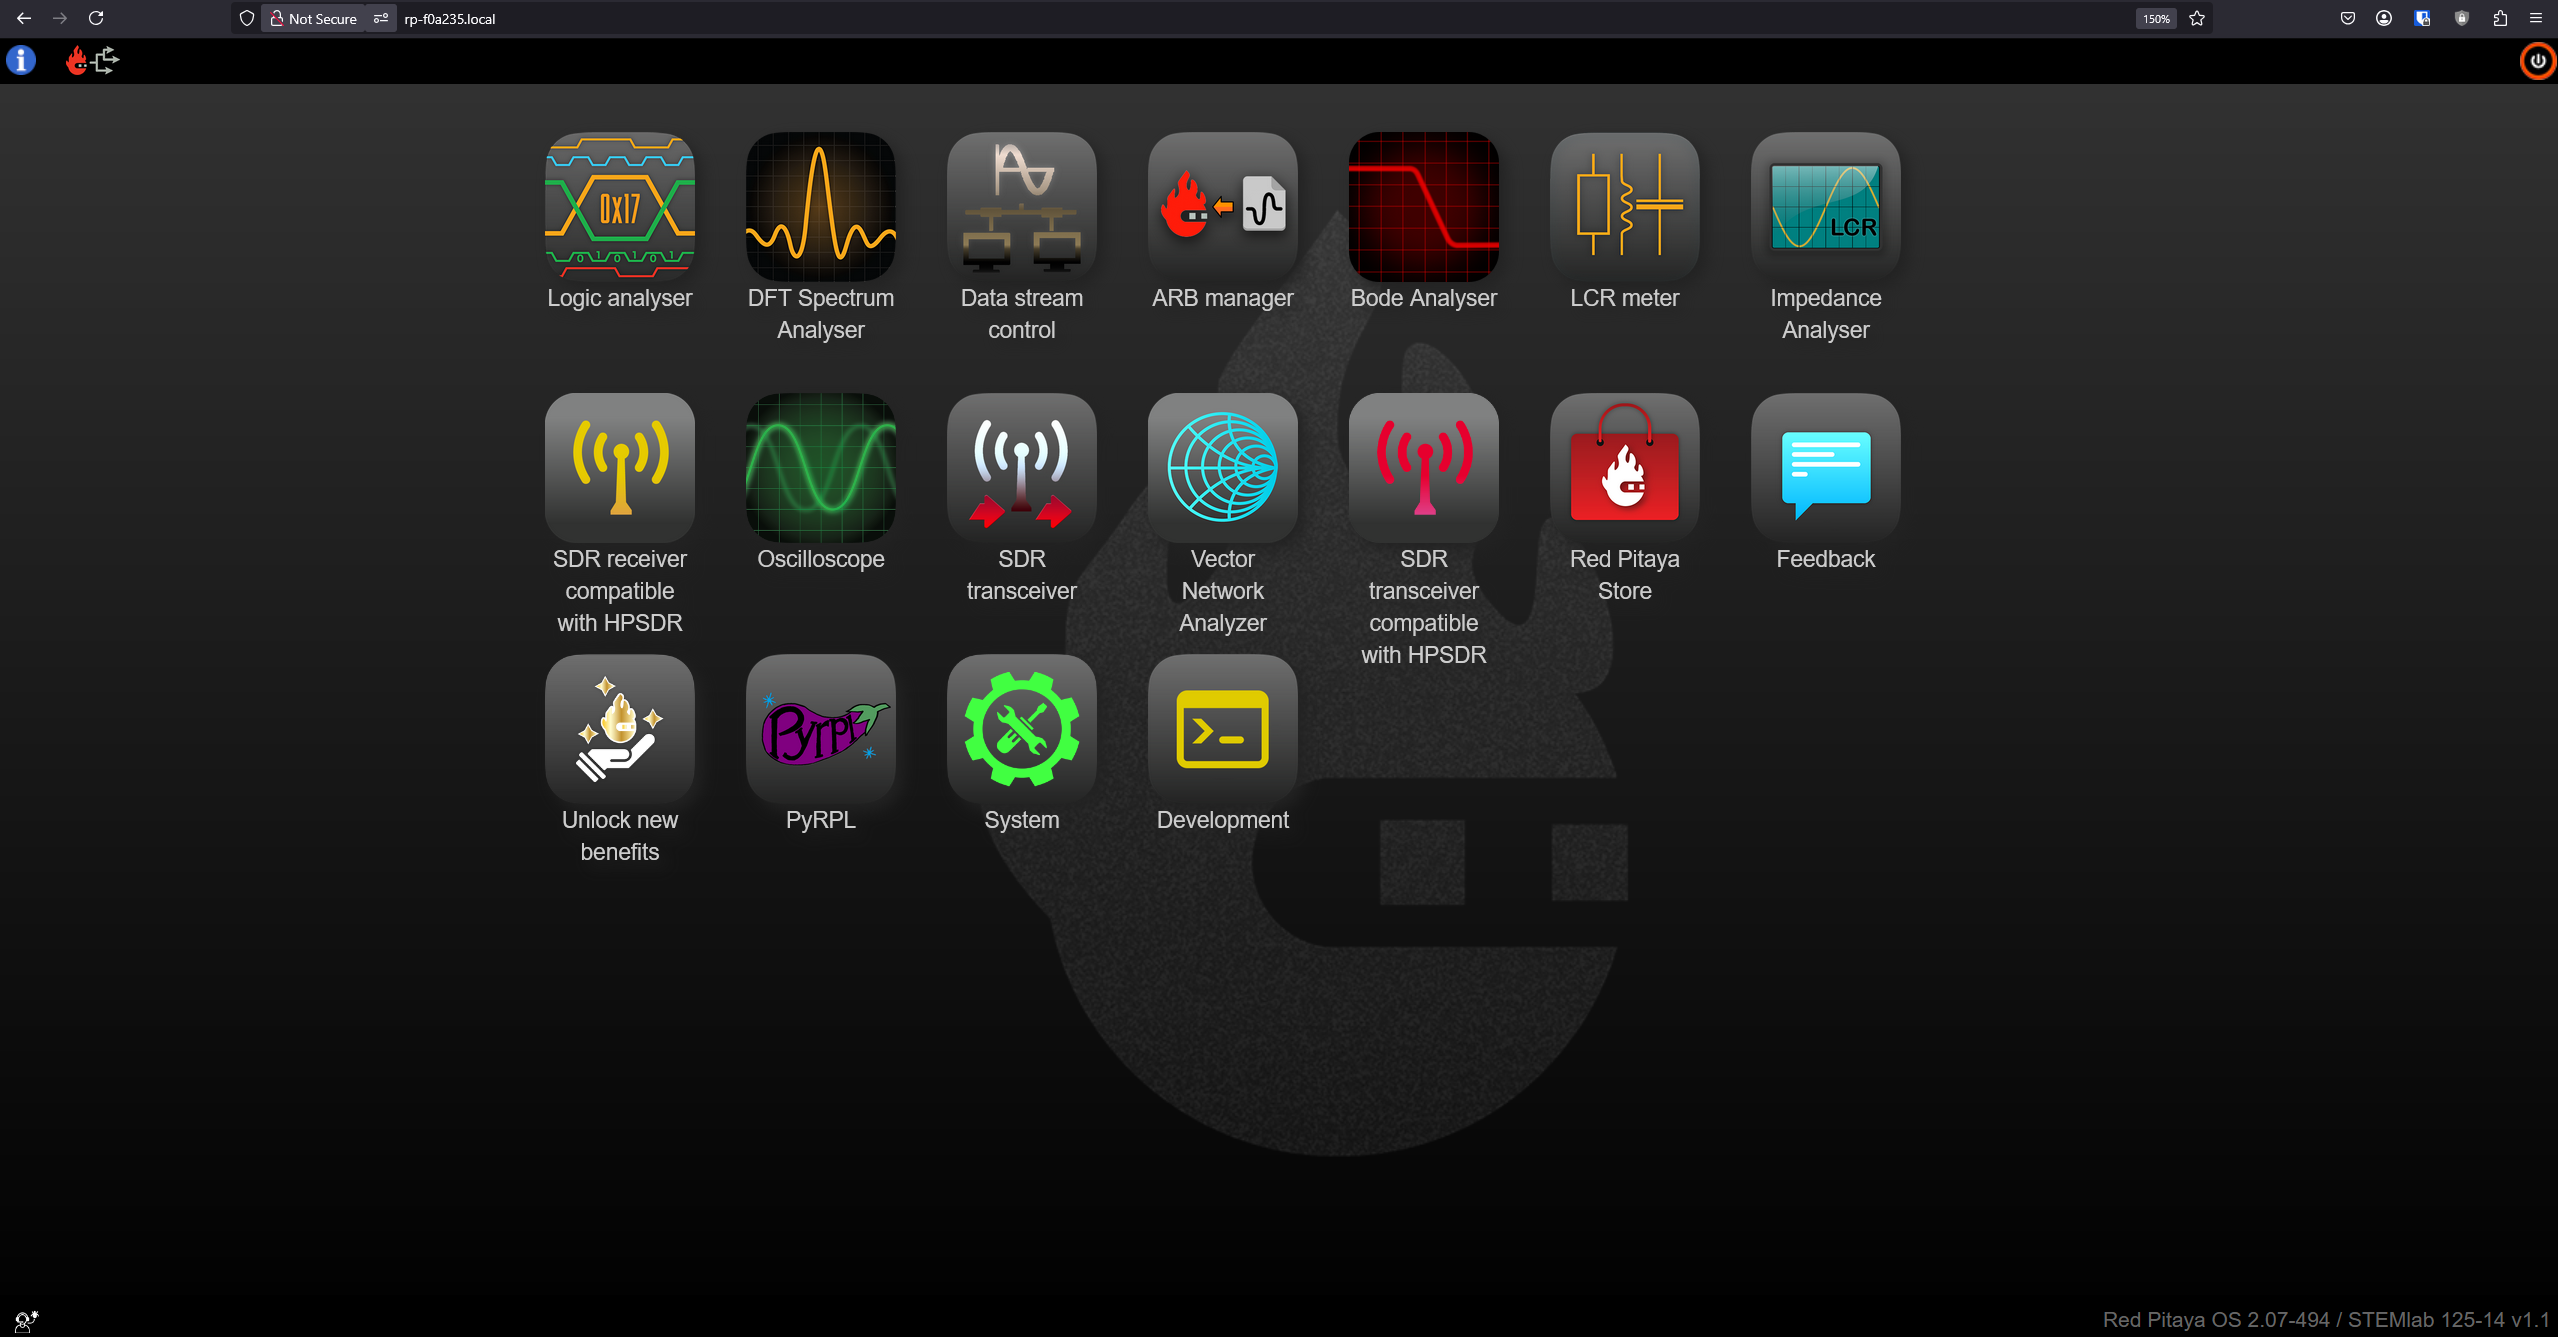
Figure 2.1 Red Pitaya’s main page user interface
What’s next?
Here’s a quick video tutorial on using the Red Pitaya web interface:
You can now:
Explore the built-in applications (Oscilloscope, Signal Generator, Spectrum Analyzer, etc.)
Check out the Applications & Features section for tutorials
For alternative connection methods (Wi-Fi, direct connection), see the Network manager tool chapter
2.3.6. Troubleshooting
If you’re having trouble connecting:
Can’t access rp-xxxxxx.local:
Verify you’re using the correct MAC address from your board’s sticker
Try adding or removing the trailing slash:
rp-xxxxxx.local/vsrp-xxxxxx.localMake sure your computer and Red Pitaya are on the same network
Try Method 2 (IP address) instead
Red Pitaya doesn’t boot (no LED activity):
Check the power supply (must be 5V 2A minimum)
Verify the SD card is properly inserted
If using QSPI eMMC board, make sure you pressed the P-ON button
LED pattern looks wrong:
Watch the LED boot sequence video above to compare
The SD card may be corrupted - try re-imaging it
For more help:
Check the comprehensive troubleshooting guide or ask on the Red Pitaya Forum.
If you need to contact support, please provide:
Board model (e.g., STEMlab 125-14 Gen 2, SIGNALlab 250-12)
Board variation (if any): Low Noise, External Clock, etc.
OS version (shown in bottom-right corner of web interface)
Detailed description of the problem
Steps you’ve already tried